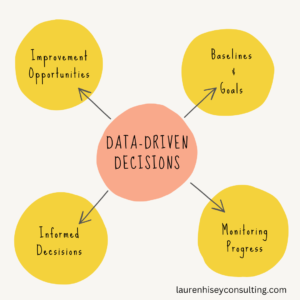
Data-Driven Decisions
- Improved Opportunities
- Baseline and Goals
- Monitoring Progress
- Informed Decisions
Leveraging Lean Six Metrics for Data-Driven Decision-Making
Organizations face constant pressure to improve efficiencies, reduce costs, enhance customer sanctification, and improve employee work-life. To achieve these goals, data-driven decision-making has become a critical practice. Lean Six Sigma Metrics can help you achieve these data-driven decisions.
The Role of Metrics in Lean Six Sigma
Metrics play a crucial role in Lean Six Sigma. They give us objective measurements of how well things are going, guide our choices, and help us track progress. Let’s dive into some key metrics:
1 Defect Rate (DPMO)
Defects are like those little hiccups that happen when things don’t go as planned. The Defects Per Million Opportunities (DPMO) metric helps us count these hiccups. It tells us how many defects occur per one million opportunities. For example, if a process produces 50 defective widgets out of every million, the DPMO is 50,000.
2 Process Cycle Efficiency (PCE)
PCE measures how efficiently we’re doing things It considers both the time spent on activities that directly benefit our customers (the good stuff) and the time spent on non-value-added activities (the not-so-good stuff) A higher PCE means we’re streamlining our processes.
3 First Pass Yield (FPY)
FPY is like hitting the bullseye on the first try It’s the percentage of products or services that meet quality standards right off the bat A low FPY means we’re doing a lot of rework, which isn’t ideal.
4 Lead Time
Lead time is the time it takes to get things done. Reducing lead time means happier customers and smoother operations.
5 Cost of Poor Quality (COPQ)
COPQ includes all the costs of defects, rework, scrap, and customer complaints. By monitoring COPQ, we can allocate our resources wisely.
Leveraging Metrics for Smart Choices
Now, let’s talk about how we can use these metrics to make better decisions:
1 Improvement Opportunities
Metrics illuminate areas for improvement. For instance, a high DPMO might prompt us to investigate and fix quality issues.
2 Baseline and Goals
Before we start making changes, let’s establish our baseline metrics Then, we can set realistic improvement goals If our current FPY is 80%, let’s aim for 95% after some tweaks.
3 Monitoring Progress
Regularly checking our metrics helps us see how we’re doing. Control charts are like our trusty binoculars—they help us spot trends and unexpected changes.
4 Informed Decisions
When faced with choices, let’s turn to our data. Should we invest in that shiny new equipment? Let’s analyze its impact on COPQ and PCE. Data-driven decisions are like having a compass in a dense forest—they keep us on track.
Case Study: Tackling Late Deliveries
Imagine a retail company drowning in customer complaints about late deliveries. Armed with Lean Six Sigma metrics, they:
- Measured Lead Time: Found out it was taking them an average of 10 days to deliver.
- Set a Goal: Aimed to reduce lead time to 7 days (a 30% improvement).
- Investigated Causes: Discovered bottlenecks in order processing and shipping.
- She made changes, such as streamlining processes, automating order tracking, and improving supplier communication.
- Measured Again: Their lead time dropped to 6.5 days three months later.
Result: Happier customers and saved shipping costs.
Conclusion
Lean Six Sigma reminds us that numbers matter By using metrics, we can spot opportunities, track progress, and make informed choices So, let’s measure, improve, and keep our compass pointed toward excellence!
Now, go forth and make data your trusty sidekick! 📊🚀
Ready to learn how to apply Lean Six Sigma to your organization?
We offer Lean Six Sigma consulting and coaching. Let’s set up some time to talk further.
Follow us on LinkedIn.
Leave a Reply